ntn-observability
ntn-observability is the ns3-ntn-toolkit module that streams every ns-3 NTN trace source into InfluxDB line protocol with pre-built Grafana dashboards and emits NetSimulyzer JSON for 3D playback, all keyed to a stable, pinned KPI schema. It also captures a reproducibility manifest so a satellite-network experiment can be replayed and audited.
Why it matters. NTN simulations generate dense, multi-layer telemetry (radio quality, timing advance, handover counts, inter-satellite-link load, slice satisfaction) that is hard to inspect from raw logs. Researchers and engineers need live dashboards, 3D visualization, and a canonical metric naming scheme so results stay comparable across runs and downstream dashboards do not silently break. This module turns ns-3 trace sources into queryable time series and replayable scenes with one helper call.
What it simulates
- InfluxDB line-protocol sink (
NtnInfluxSink): buffers and transports points over UDP (default port 8089) or to a file, with a configurable buffer (default 1,000,000 points),GetEmittedCount()/GetDroppedPoints()accounting, and drop-oldest overflow behavior. - Canonical, pinned KPI schema (
ntn-metric-schema.h): snake_case measurements includingntn_radio,ntn_handover,ntn_isl,ntn_timing_advance,ntn_sib19,ntn_drx,ntn_sat_pos,ntn_slice,ntn_beam, andntn_oran_kpm; tags such ascell_id,ue_imsi,sat_norad,slice_sst,payload_mode,run_id; and fields includingrsrp_dbm,sinr_db,bler,ta_total_us,ho_exec_count,isl_load_mbps, andslice_latency_p99_ms. The schema is pinned by a stability test so dashboards do not break. - NetSimulyzer exporter (
NtnNetSimulyzerExporter): emits NIST NetSimulyzer 1.0 JSON for 3D playback, withAddNode(),AddSeries(),NodeMove(),LogMessage(), andSampleSeries(). - Reproducibility manifest (
NtnReproManifest): captures git SHA, ns-3 version, scenario name, TLE epoch, NORAD IDs, constellation geometry, and CLI argv to a versioned JSON manifest that round-trips and tolerates unknown keys. - One-call helper (
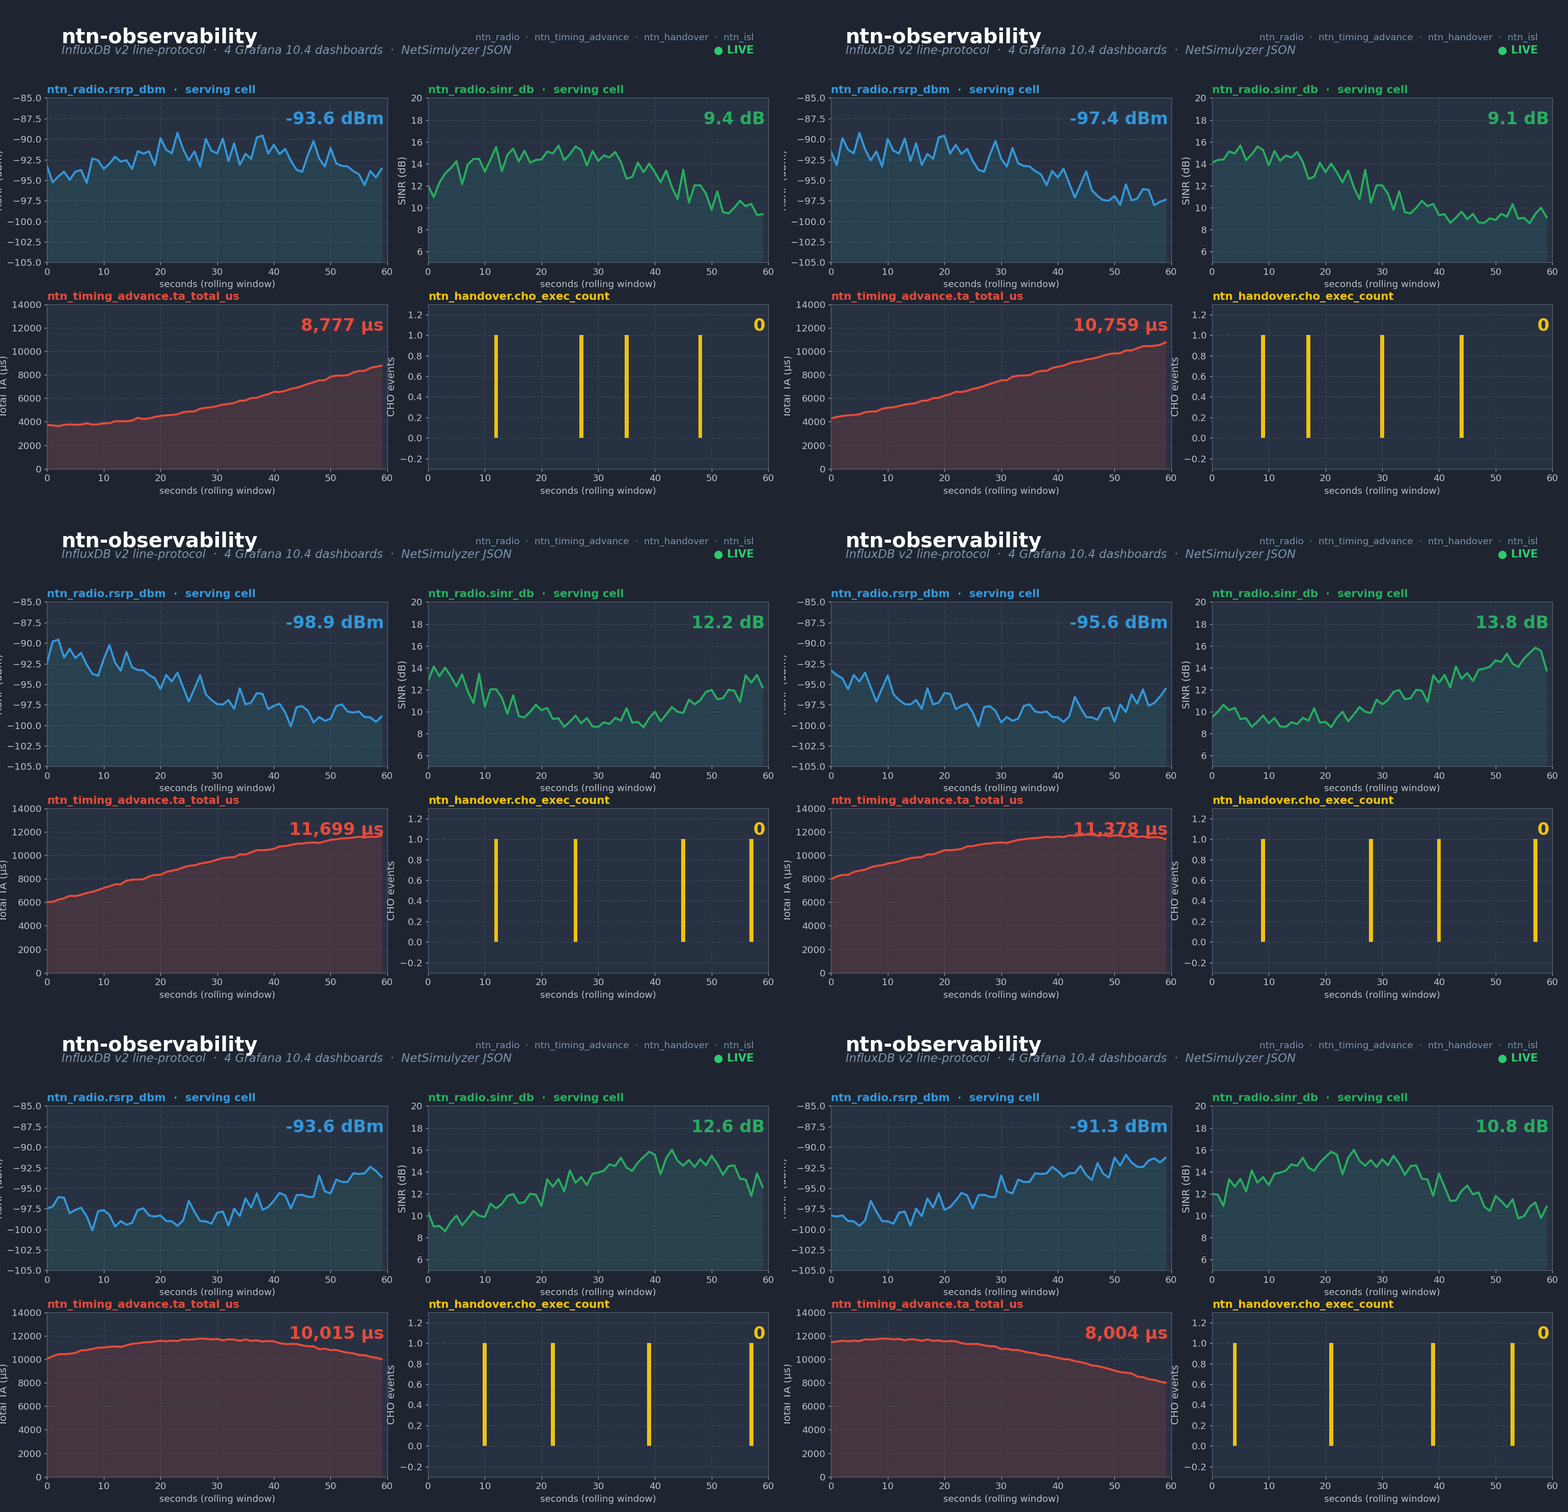
NtnObservabilityHelper):SetRunId(),SetInfluxFile()/SetInfluxUdp(),SetNetSimulyzerOutput(),SetFlushPeriod(), andInstallInfluxSink()/InstallNetSimulyzerExporter(). - Pre-built Grafana dashboards (committed JSON): Overview, Handover (success / failure / ping-pong), Radio (RSRP / SINR / TA distributions), and ISL (utilization), loaded into the
ns3-ntn-toolkitfolder. - Docker compose stack: InfluxDB 2.7, Telegraf 1.31 (rewrites simulation timestamps before HTTP push), and Grafana 10.4.0.
- O-RAN E2SM-KPM per-flow KPIs (
ntn_oran_kpm, viantn-traffic'sNtnOranAiFlowMonitor) following 3GPP TS 28.552 measurement names.
Gallery
Standards & references
- 3GPP TS 28.552: performance measurements; source of the O-RAN E2SM-KPM metric names emitted under
ntn_oran_kpm. - 3GPP TR 38.811: NTN UE model used by the demo scenario.
- NIST NetSimulyzer 1.0: 3D playback JSON schema targeted by the exporter.
- InfluxDB line protocol: wire format for the streamed time series.
Use cases
- Live experiment monitoring: watch RSRP, SINR, timing advance, and handover counts on Grafana while an ns-3 LEO pass runs.
- 3D scenario review: replay satellite and UE motion plus KPI series in NetSimulyzer for presentations and debugging.
- Reproducible studies: attach a manifest (git SHA, TLE epoch, constellation) to every run so results can be audited and replayed.
- O-RAN KPM analytics: stream per-flow E2SM-KPM-style KPIs to feed xApp or rApp evaluation pipelines.
- Cross-run benchmarking: rely on the pinned schema so dashboards and queries stay valid as scenarios evolve.
Run it
./ns3 run "ntn-observability-demo --simTime=20 --runId=local-1 --influxFile=/tmp/run.lp --netSim=/tmp/run.json"
This runs a real mmwave NR NTN cell (SGP4 satellite, TR 38.811 UE, eMBB stream) with the full ntn-rrc stack, writing InfluxDB line protocol to /tmp/run.lp, a NetSimulyzer trace to /tmp/run.json, and a sim_health.csv provenance file. To stream straight to the Docker stack, bring it up with cd contrib/ntn-observability/docker && docker compose up -d and point the example at the UDP host. The saturating-traffic variant ntn-observability-traffic exports per-flow KPM series.
Scope
Streams every ns-3 trace source into InfluxDB (line protocol over UDP) with pre-built Grafana dashboards, plus emits NetSimulyzer JSON for 3D playback.
| Component | What it does |
|---|---|
ntn-influx-sink |
ns-3 trace → InfluxDB line protocol (UDP + file mode) |
ntn-netsimulyzer-helper |
Wraps NIST JsonHandler for NTN nodes |
ntn-metric-schema.h |
Canonical KPI names: RSRP, SINR, TA, HOcount, ISL load, slice latency |
What ships
- 4 pre-built Grafana dashboards (committed JSON):
ntn-overview.json- top-level KPIsntn-handover.json- HO success / failure / ping-pongntn-radio.json- RSRP / SINR / TA distributionsntn-isl.json- ISL utilisation
- Docker compose stack: InfluxDB 2.7 + Telegraf 1.31 + Grafana 10.4
Validation gates
- 5/5 unit tests pass: line-protocol encode + escape + file-sink round-trip + NetSimulyzer JSON shape + schema stability
-
ntn-observability-demoproduces 314 line-protocol points + 95 NetSimulyzer events in 30 s - All 4 dashboards parse as valid Grafana JSON with non-empty Flux queries
- End-to-end pipeline test passes in file mode; docker-mode auto-skips when InfluxDB is not running
Quickstart
cd contrib/ntn-observability/docker
docker compose up -d
# Grafana → http://localhost:3000  (admin / admin)
# InfluxDB → http://localhost:8086

cd ../../..
./ns3 run ntn-observability-demo